

Data professionals have very strong opinions about pie charts. In fact, The Hidden Speaker has its own article explaining all the reasons why they make a poor choice of visualization. However, despite all that intense criticism, pie charts have still managed to become firmly entrenched in our presentation vocabulary. So the game-changing question is: when is using a pie chart ok?
There is one use case where pie charts are, hard as it is to say, perhaps the best graphical choice:
- There are 2-3 parts of a whole
- 1 Category has a proportion over 50%
Our previous article on Gestalt psychology explains why pie charts work so well for this use case. In essence, our brains process the plethora of environmental stimuli by framing them into concise, meaningful patterns. For pie charts, the Gestalt principle of proximity applies: all the slices are perceived as a related group because of their close proximity. A bar chart showing the same data would fail to deliver the same “parts-of-a-whole” relationship because each bar would be a spatially-separated entity.
The reason for the very specific “2-3 parts of a whole” comes down to an issue of visual noise. When the number of data points in a pie chart grows too large, too many colors and too many data labels are needed to uniquely represent each slice, as we discuss in detail here. This issue can be largely mitigated when the total is limited to 2 or 3. Then the viewer can focus on the most important takeaway: what slice has the dominant proportion.
In this post, we’ll break down how the investment management company Wealthsimple used pie charts in its 2014 pitch deck, and whether or not they adhered to these graphical guidelines.
Example #1: No Proportion Over 50%
The first example from Wealthsimple’s pitch deck involves a pie chart with no proportion over 50%. As you look at the slide below, think about what jumps out as the most salient insight.
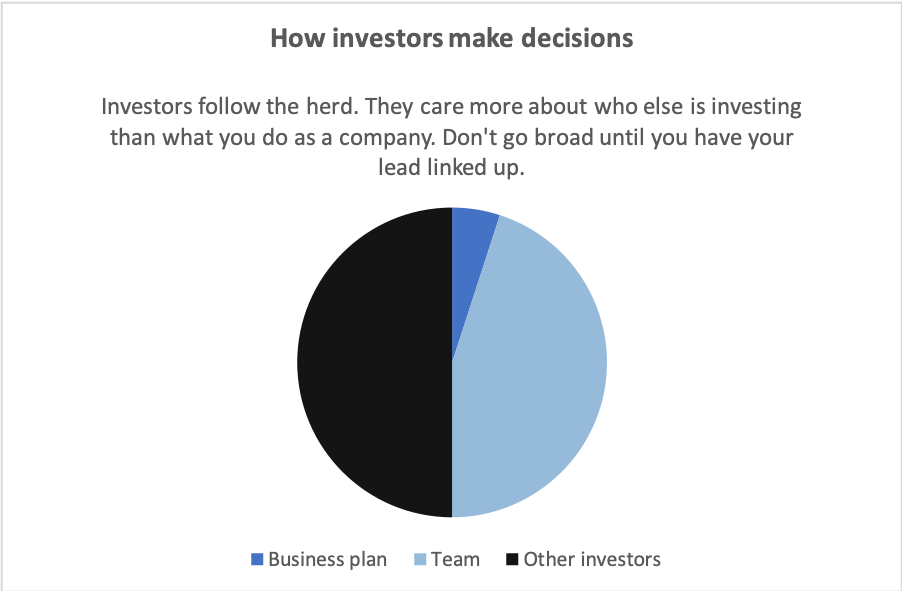
From a purely visual standpoint, you’d probably conclude: ‘”Other investors” make up half the total’. While true, the slide’s actual message is something very different. According to the supplementary text, investors care “more about who else is investing than what you do as as company.” In other words, the slide’s major takeaway is: ‘”Other investors” are the majority of the total’.
The issue here is one of cognitive dissonance. “Majority” is typically associated with quantities more than half. So there will be inherent tension when we see the slice with half the total and need to rationalize that it is also a “majority” slice.
To fix this issue, consider what happens when a bar chart is used to represent the same data:
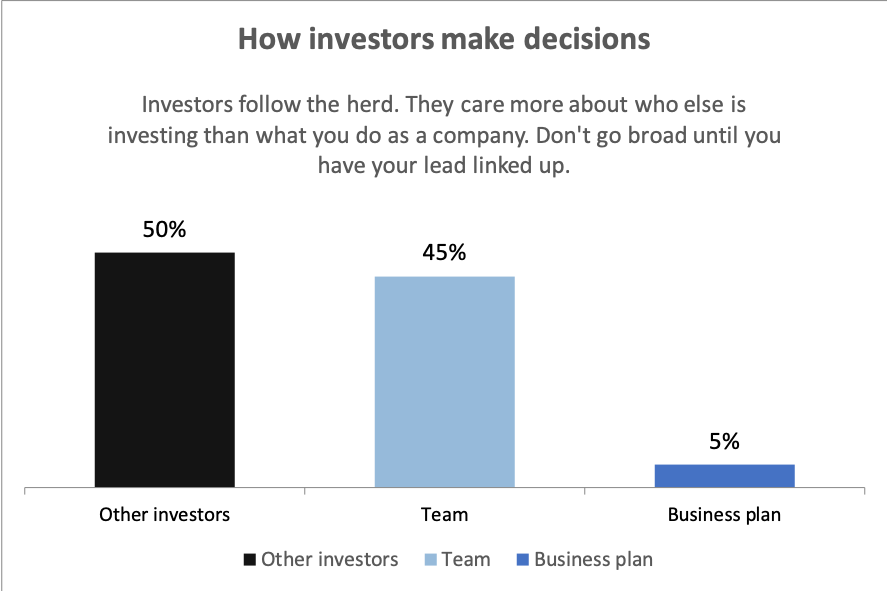
Because the bar chart does not use the Gestalt proximity principle to signal “parts-of-a-whole”, the viewer is encouraged to compare the height of each bar with all the others. The “Other investors” bar now stands out as the tallest bar with a dominant proportion of 50%. Here, 50% does not mean “half”. It means “more“.
To sum up, it is best to use a pie chart when one slice has a proportion over 50%. That way, the pie chart will strongly indicate to the viewer, without ambiguity, that one category has the greatest percentage of the total.
Example #2: Not Parts of a Whole
Let’s take a look at another example that emphasizes why the “parts-of-a-whole” guideline is so important:
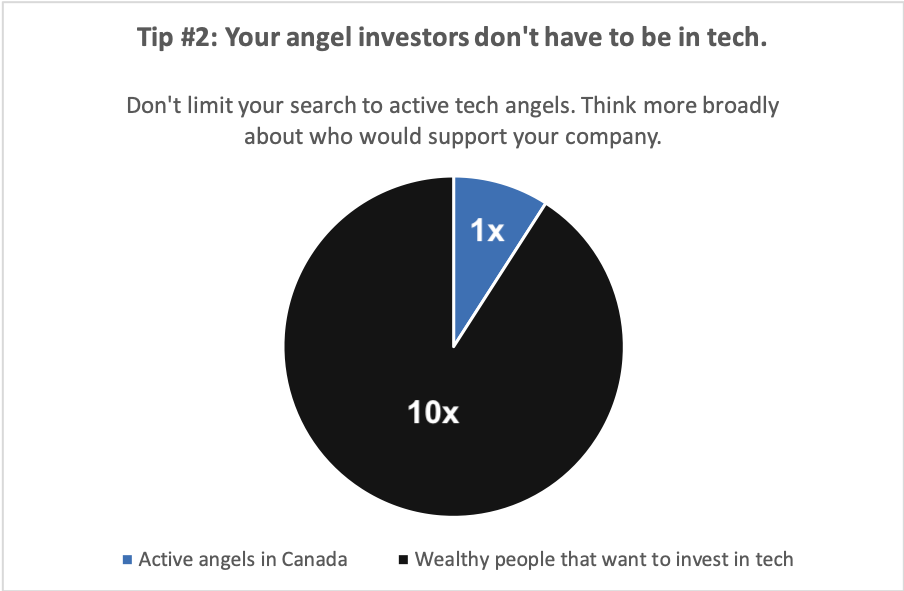
The graph above fits almost all the criteria of our pie chart guidelines. There are only 2 parts. And one category, “Wealthy people that want to invest in tech,” appears to have a proportion over 50%. But those parts are not “parts of a whole”. The story this slide is trying to convey is the following: “There are 10 times more Wealthy people that want to invest in tech than Active angels in Canada”. While the pie chart excels at showing fractions, it does a very poor job of enabling comparisons between different categories. Does the “10x” slice appear 10 times bigger than the “1x” slice? It is extremely hard to tell.
Wealthsimple was aware of this potential pitfall. The actual slide used in its presentation is displayed below:
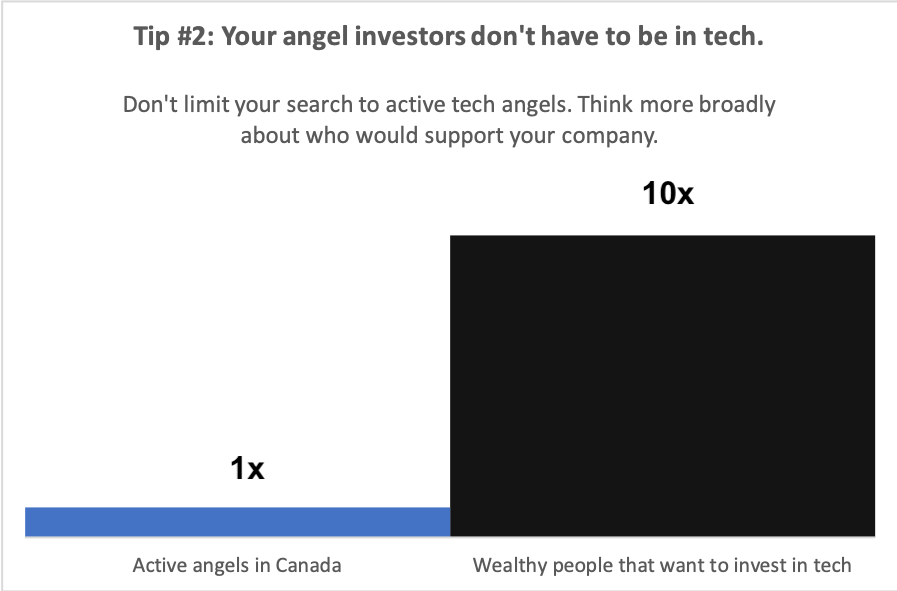
Bar charts like this one encourage viewers to compare the height of each bar to all the others. Here, the “10x” bar appears to be exactly 10 times larger than the “1x” bar. And that discrepancy in height (i.e. by 10x) is the focal point of this chart, in line with the story the slide wants to tell.
Example #3: Just Right
Finally, below is an example of a slide from Wealthsimple’s pitch deck that fits all the criteria of our pie chart guidelines:
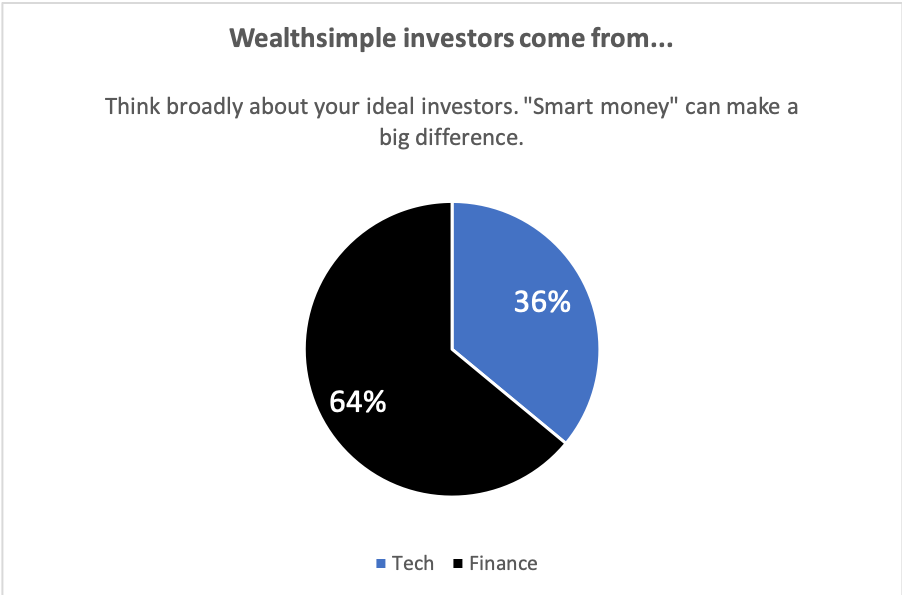
There are only 2 parts of a whole. And one category “Finance” has a proportion over 50%. The chart’s underlying story jumps out at the viewer: “Most Wealthsimple investors come from Finance.” The “64% category” occupies the largest fraction of the circle, visually indicating its dominant proportion. And, because of the Gestalt proximity principle at play in pie charts, it is clear that Finance and Tech are part of the same group of total investors.
When it comes to pie charts, simplicity is key. They are fantastic for showing parts-of-whole relationships, but, specifically, simple parts-of-whole relationships in which one category is the largest of the 2 or 3.
Summary
When designing your own slides and considering what chart to use to represent your data, remember that a pie chart is an excellent choice when the following guidelines are met:
- There are 2-3 parts of a whole
- 1 Category has a proportion over 50%

